If you are presenting data on a page or post, a chart would definitely prove your point.
Now, you can go the short and easy way and upload an image of that chart to your WordPress page or post. Or, you could go for a dynamic chart that changes its values over time.
So, if your data updates from time to time, and you don’t want to revisit your charts too often, there are some great chart WordPress plugins that can help you out. Charts are not a WordPress built-in thing, that’s why you need to use a third-party plugin.
So, I’m going to show you the 3 most popular WordPress chart plugins in the ecosystem.
But first, here’s how you can install any WordPress plugin in less than 3 minutes.
Now, let’s roll!
wpData Tables

Source: wpDataTables
Active installations: >50.000
Pricing: starting €53.
Don’t let yourself be fooled by the name. This plugin handles both charts and tables in WordPress.
With wpDataTables you can easily create charts from Excel, CSV, PHP and other data sources.
The plugin allows creating 14 different chart types using the Google Charts rendering engine: line, pie, column, area, stepped area, histogram, bar, stacked bar, bubble, donut, scatter, gauge, candlestick, and waterfall. Pfew, those were a lot.
Here are the steps for creating your much-needed WordPress chart with wpData Tables:
From the WordPress dashboard, head over to wpDataTables -> Create a Chart.

Name your chart and select the render engine. For free plans, Google Charts is the only choice. For paid ones, you can select HighCharts or Charts.js, as well.

When selecting Google, you’ll see the 14 chart options mentioned above.

Select a type of chart, then hit “Next”, from the bottom-right.
Now, the data you use as a source should be inside a wpDataTable.

This means that you’ll need to create a wpData Table chart first. Don’t worry, it’s as easy as hitting Next->Next->Save.
You’ll just have to select a number of rows and columns, and populate them with data.

Once you have added the table source to your chart, make sure to format it.
When you’re done, a shortcode will get generated. Just place it where you want on a page or post.
That’s it!
Visualizer – Tables and Charts Manager for WordPress

Source: Themeisle
Active installations: >40.000
Pricing: starting €59.
The Visualizer WordPress chart plugin is a really powerful one. It allows you to create, manage and embed interactive, responsive charts into your WordPress posts and pages.
There are 15 chart types available (out of which 6 are in PRO version).
Now, let’s work a bit with the plugin, shall we?
After activating it, head over to the WordPress dashboard. From the menu on the left, select Visualizer -> Add new chart.

Next, a new window will show up with a series of chart types. Choose the one you need.

After clicking on the “Next” button, you’ll see on the right some options for the chart data source. You can upload your own CSV file, which is awesome, but also from other sources (in the paid plan of the plugin).

After data import, you can go to “Settings”, from the menu on the right.
Now it’s time to format our chart.

When done, don’t forget to save the chart.
You can always come back to the chart and make later edits.

Now, all that’s left is to place the chart inside a WordPress post or page.
Here’s the magic button for this:

When you click on it, you’ll see the following message: “The shortcode has been copied to your clipboard. Hit Ctrl-V/Cmd-V to paste it”.
Just paste the chart and call it a day!
Data Tables Generator by Supsystic

Source: Supsystic
Active installs: >30.000
Pricing: starting $46.
Now, as for the case of wpData Tables, you will need first to create a table that you will be using afterwards as the chart’s data source.
So, here we go.
First we need to go to the WordPress dashboard, and from the menu on the left, head over to “Tables by Supsystic”. Then select “Tables”.

Now, we need to naem the table and establish the number of rows and columns.

Next, hit “Create”.
Next you’ll see an option to fill in the data for your table.

Above the table you’ll be seeing a menu. Select “Diagram”

And, from now on, you’ll have to acquire one of the licences…
But the tool seemed very intuitive so far, with lots of customizations and formatting options available.
How to add a WordPress chart shortcode to a page
As you’ve already noticed, all the plugins mentioned above allow you to create tables and charts, and will generate in the back a shortcode that you can paste on your desired page.
Now, if you’re using the Classic Editor, copy-paste would do. If you’re using the Default Gutenberg Editor, you will need to use the shortcode block.
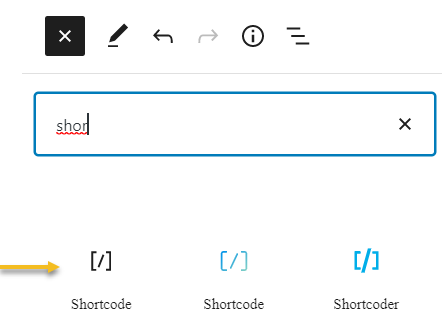
When inside a page or post, head over to any “+” sign and click on it. You’ll be seeing the block inserter. Type “Shortcode” and click on the block once you see it.

The blue-green shortcoe icon is the Kubio shortcode block, while the black one is the default Gutenberg one. They have the same function, except for the fact that with the Kubio shortcode block you have acces to some extra styling options.
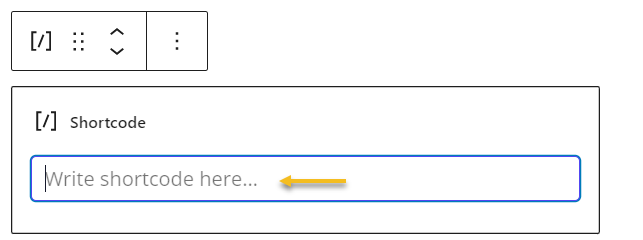
All you have to do now, is paste the shortcode inside the block. In the page’s live preview you will see your chart.

And that’s a wrap, folks!
You now know which are the 3 most popular WordPress chart plugins out there and how to use them.
Happy WordPress-ing!
Feel free to check the rest of our articles on our blog or Kubio tutorials on Youtube.


