
Data is the new oil…some wise men once said.
Accurate data can help businesses:
- make better-informed decisions,
- better understand their customers,
- make budget allocation across marketing channels,
- decide on future content strategies,
- identify most performing ad campaigns,
- identify where the business is leaking money,
- Improve website navigability,
- develop new products,
and much more.
Now, most of you have probably heard about Google Analytics and how it can help you understand website user behavior, and analyze traffic acquisition data.
But, there are other tools that can give you precious website insights.
Enter heatmaps!
A website heatmap is a real-time data visualization tool that helps businesses understand how website visitors behave on a particular page. Heatmaps use a warm-to-cold color scheme to spot the most frequented website sections or the least frequented ones. In this color scheme, the hot areas signify high user engagement, while the cold ones show a lack of engagement.
Heatmaps can fill in the gaps for what Google Analytics can’t offer you, eg:
- why didn’t users finish check-out?
- why do users exit at a certain section of a site?
- why do I have a far lower conversion rate for the mobile version of my site?
- what distracted the user from clicking on my call to action?
- why don’t I have enough video plays?
and more. Like you see above it all revolves around “WHY”.
In the end, they are complementary tools. Google Analytics is a quantitative tool, while heatmaps are qualitative tools.
Usually, the tools that provide you heatmaps can also show you:
- Scroll maps: visual representations of your visitors’ scrolling behavior. They show how far users are scrolling, and the specific website section where they decide to exit.
- Click maps: visual representations showing you the elements that get the most clicks on a page.
- Session recordings: data tools that capture the entire journey of a user on your site in a video format, from the entrance to exit. It shows clicks, scrolls, mouse movements, forms being filled, etc.
When I first used such a tool I was completely bewildered. It was back in 2017 and I used such tools to:
- Identify bugs on a hotel booking site
- Formulate insights into improving the website’s UX
Cool, don’t you think?
Why should you use heatmaps on your WordPress website?
Because we all want to find out the “WHY” behind user behavior, don’t we?
Heatmaps help businesses identify:
- Website bugs,
- Friction areas (maybe you realize a form has too many fields, that end up not being filled in, etc),
- The behavior of certain user segments: by device, browser, country,
- Why some pages don’t get the expected traffic,
In the end, based on these insights, you create AB tests that can result in:
- More sign-ups,
- Improved website navigation,
- Better UI elements,
- Lower bounce rates,
- Improved conversion rates,
- Increased sales values,
But, there’s always a but. The advice here is: don’t rush to conclusions. Don’t formulate a general assumption based on too-small sample size. Ideally, you should combine heatmaps with Google Analytics, and session recordings. Also, the sources of traffic are very important. What if you got your target audience all wrong? This would definitely explain a lot.
Now, that we cleared this out, let’s see which are the most popular heatmap plugins in the WordPress ecosystem.
WordPress heatmap plugins: our 4 recommendations
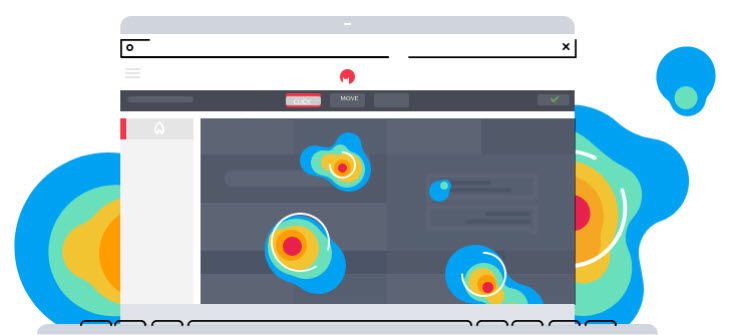
Source: Hotjar
Now, in order for a heatmap tool to be able to track user behavior, you’ll need to install a script on your website. You can do this pretty easily via Google Tag Manager, or you could ask an in-house developer to deploy it. The script is provided by the tool itself, and the installation is pretty straightforward.
Now, let’s check our 4 recommendations!
Meet:
In the table below I am going to analyze their features a bit. I felt that this is the most straightforward way to make a comparison between these tools.
| CrazyEgg | Hotjar | Smartlook | Mouseflow | |
| Heatmaps | yes | yes | yes | yes |
| Session recordings | yes | yes | yes | yes |
| Scroll heatmaps | yes | yes | yes | yes |
| Other features | Filter by traffic source, A/B testing interface | Targeting options, Surveys, Instant visual feedback, Unlimited team members | Event tracking, Retroactive event data, Build conversion funnels, Filtering & segmentation, Mobile app sessions | Funnel setting up, Set up feedback campaign |
| Used by | 300,000+ websites | 680,000+ organizations | 300,000+ users | 165,000+ clients |
| Famous clients | Intuit, DELL, Microsoft, Nintendo, Yahoo | Adobe, Ryanair, Decathlon | Adobe Ryanair Unbounce Decathlon Volvo, Vogue, Sanofi, Miele | Vodafone, E-on, Dyson |
Now, when you analyze these products, you should consider:
- Product features – do you need also the A/B testing feature, or the survey one?
- Product pricing – usually, the pricing for such tools varies depending on the number of sessions recorded.
- How much time the session recordings get stored
- How many websites you can track
Wrapping up
Heatmaps are awesome website behavior user research tools. They can provide valuable insights that can help you increase your sales, improve website performance, and more.
There are tons of plugins out there that can help you with heatmaps, but we chose the 4 most popular ones. Personally, I loved working with Smartlook and Mouseflow. Now, I’m curious about your choice!
PS: If you liked this article, we invite you to read the rest on our blog.